A transparent, lightweight SaaS console for monitoring Windows Server 2016+ VPS nodes. Track RDP sessions, resource telemetry, firewall blocks, and complete audit trails — all in one place.
No credit card required · Free forever for personal use · Agent is fully open-source
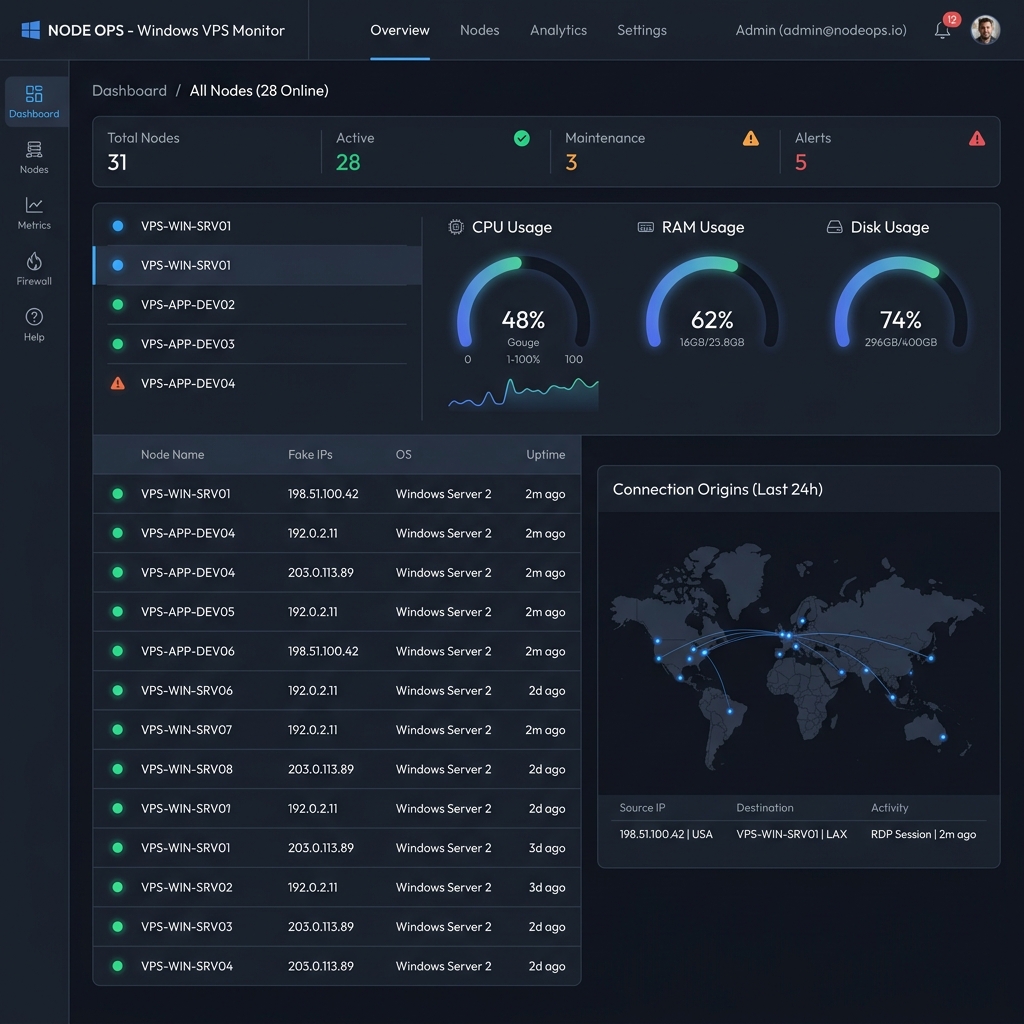
Every module is purpose-built to give you complete visibility into your Windows Server fleet without the RAM overhead of enterprise agents.
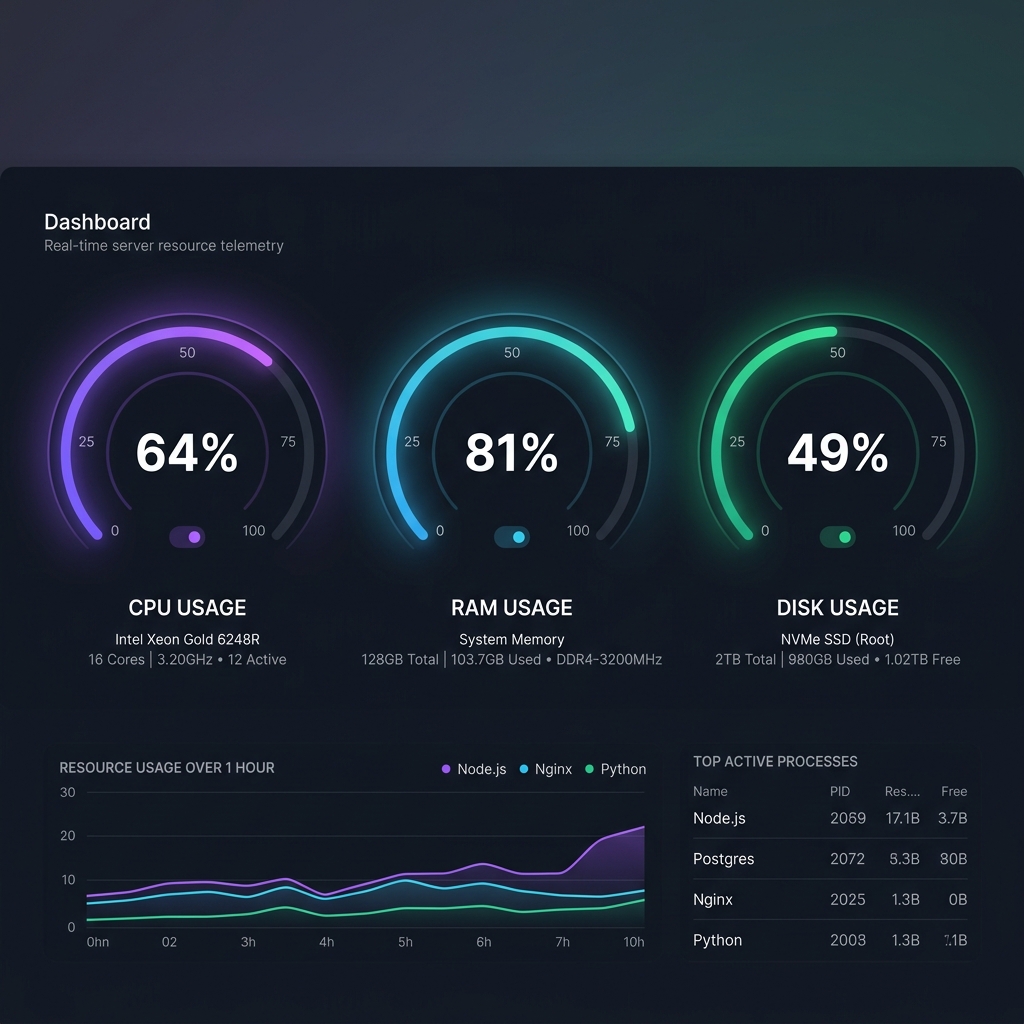
Live circular gauge dials for CPU, RAM, and Disk usage with configurable threshold alerts. Historical sparkline charts show usage trends over time. Get notified by email the moment any resource exceeds your set limit.
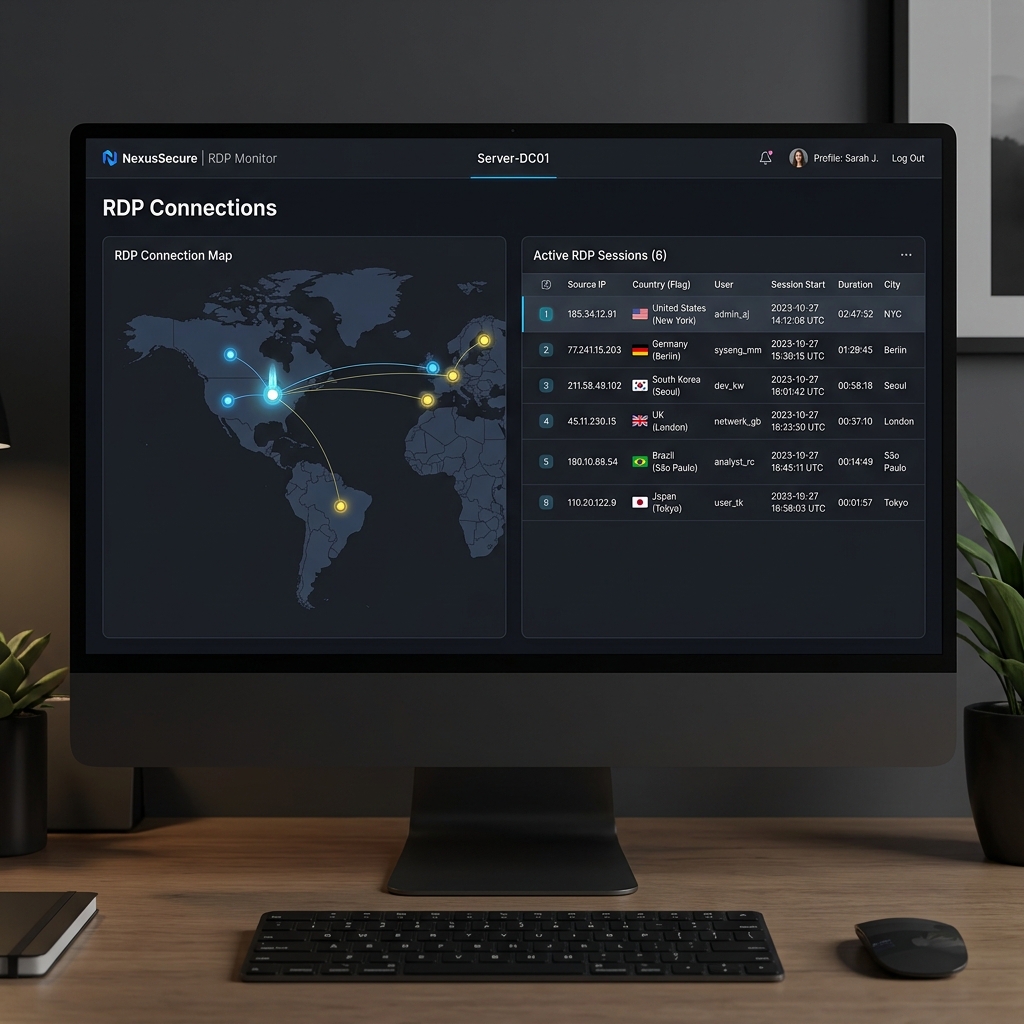
LiveSee every active and recent RDP session in real time — including the source IP, country flag, city, connection port, session start time, and current status. A built-in world threat map visualises where connections are coming from.
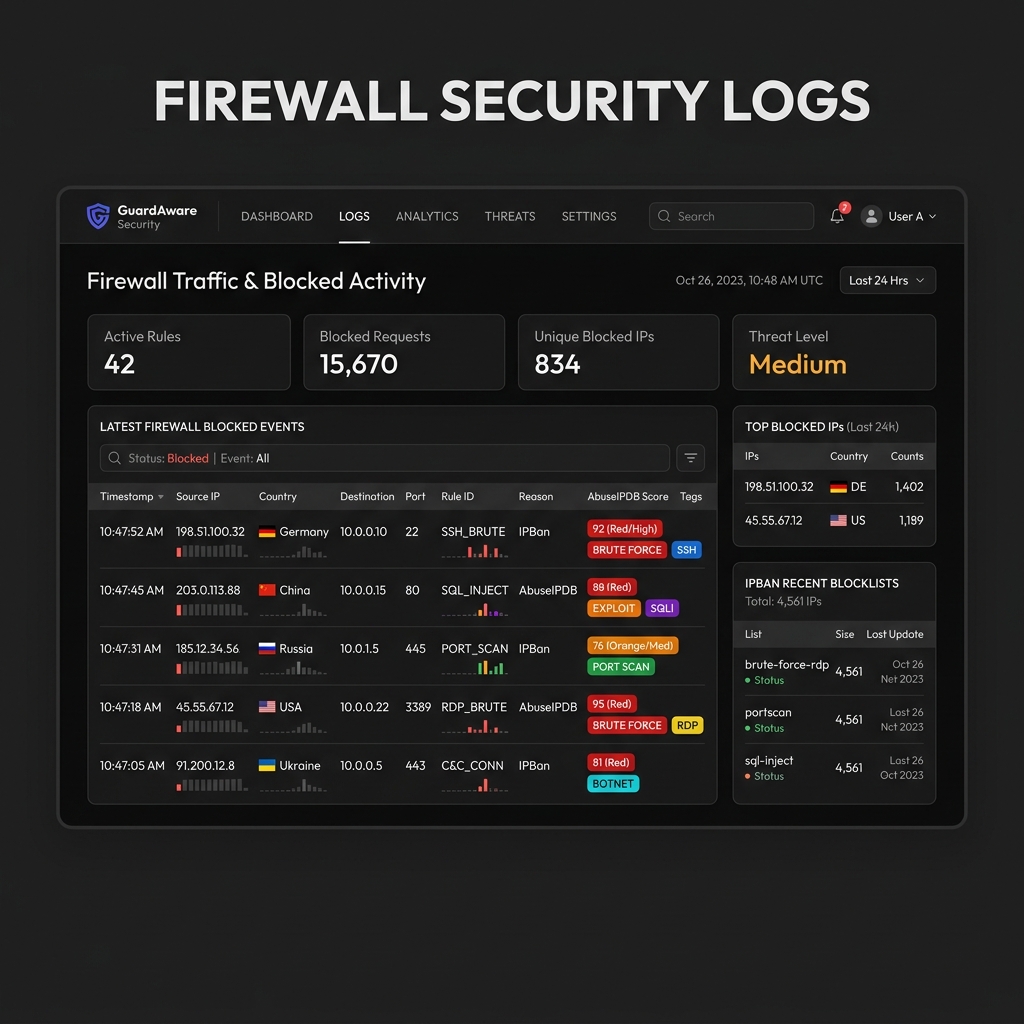
LiveDirectly read your server's IPBan blocked-IP list and cross-reference each entry against the AbuseIPDB threat intelligence database. See threat confidence scores, abuse categories, and last-reported timestamps for every blocked address.
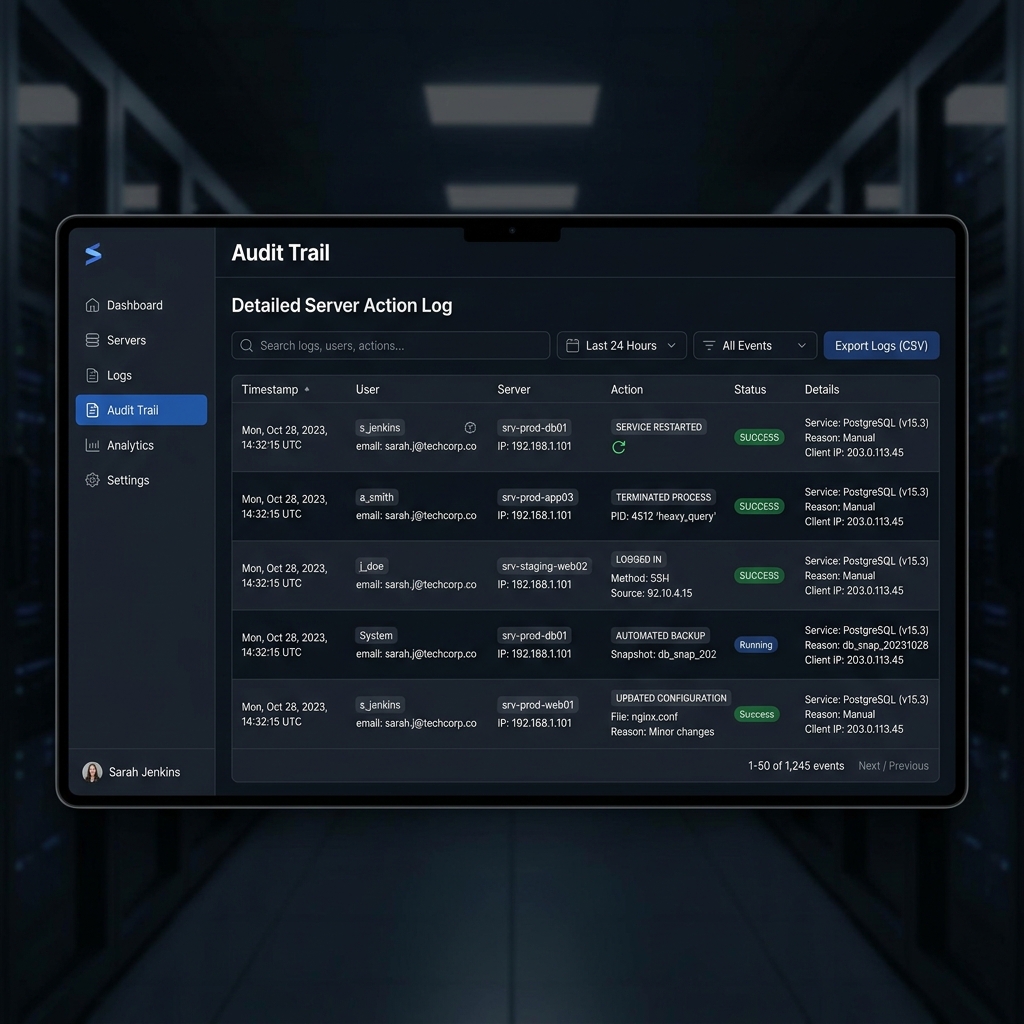
NewEvery action taken through the dashboard is recorded — service restarts, process terminations, firewall updates, remote reboots, and logins. Filter by event type, server, or date range and export the history for compliance records.
LiveCheck your Windows Server's pending update list, installed patch history, and last reboot time — all without logging in via RDP. Schedule update windows and trigger restarts remotely from the central console.
Remote ControlBrowse all running and stopped Windows services, check their startup type and current state, and start, stop, or restart them remotely with a single click. No RDP session required — works through the secure agent API.
Remote ControlSee every user-visible application and background process running on your server in real time, including memory consumption and CPU share. Remotely terminate any suspicious or runaway process directly from the dashboard.
LiveConnect your own SMTP account and configure per-server alert rules. Receive beautifully formatted, branded HTML emails the moment a threshold is breached — including the VPS name, public IP, and exact metric values.
NewLaunch secure remote desktop sessions directly in your browser with one click. Access your Windows VPS instantly with audio, clipboard, and autonegotiated security protocols.
Remote AccessThe connections panel gives you a live table of every active and recently closed RDP session. Each row shows the source IP address mapped to a real country and city using geo-lookup, so you can instantly spot any unexpected foreign logins.
Three large animated circular gauge dials give you an instant read on server health. Each dial shows the live percentage alongside detailed breakdowns — core count, clock speed, total/available memory, disk read/write speeds — without any manual SSH session.
RCC Sentinel reads your server's IPBan firewall database and enriches every blocked IP entry with live threat intelligence from AbuseIPDB. You get a confidence score, abuse category tags, and the last reported date for every attacker your firewall has silently blocked.
Every action you take through RCC Sentinel — and every event detected from the server — is recorded in a searchable, filterable audit trail. This gives you a forensic-quality log for compliance purposes or post-incident investigation.
Connecting your first Windows Server node takes under five minutes. No complex configuration files, no firewall exceptions beyond one port.
Register for a free RCC Sentinel account and verify your email. Log in to the central console and navigate to the dashboard. Your admin panel is ready immediately.
Click + Add VPS, give your server a friendly name, enter its public IP address, and generate a unique API key for that node. The console is now waiting for data from it.
Open PowerShell as Administrator on your target Windows Server and paste the one-line installer command. The agent installs itself as a Windows service and begins reporting metrics within 30 seconds.
The agent installer command (copy from your dashboard, not below — it contains your API key):
Configure your own SMTP credentials and set per-server alert rules for CPU, RAM, disk, and connection thresholds. The moment a limit is crossed, RCC Sentinel sends a beautifully formatted alert email with full context — so you know exactly what happened and on which server.
Launch secure, clientless RDP sessions directly from your monitor dashboard. No remote desktop client or VPN setups required on your client device. Built with Apache Guacamole, it provides a high-performance interactive desktop session in a secure browser tab.
We built RCC Sentinel because expensive, bloated enterprise monitoring agents were consuming more RAM than the actual applications we were trying to monitor. So we built our own — and made it open source.
The Windows agent script (`monitor_agent.ps1`) is plain PowerShell. Read every line before you run it. No binaries, no obfuscated code, no hidden network calls. The installer and uninstaller are both publicly available at /deploy/.
All communication between your VPS agent and the central server is authenticated using a unique X-API-Key header per node. Any request without a valid key is rejected at the server edge before any data is processed.
RCC Sentinel is served as a fully managed SaaS console. There is no central monitor server, database, or PM2 process manager for you to host, configure, or maintain. Start monitoring with a single agent command.
Join developers and sysadmins who use RCC Sentinel to stay one step ahead of threats, downtime, and resource issues. Your first VPS node is monitored in under five minutes.
 RCC SENTINEL